Chart Patterns for Cryptocurrency: A Practical Guide to Technical Analysis

Imagine looking at a jagged line on your screen and seeing not just random noise, but a clear roadmap of where the price might go next. That is the power of chart patterns, which are visual formations created by price movements that help traders predict future market behavior. In the volatile world of cryptocurrency, these patterns act as visual clues to what other traders are thinking and doing. They represent sequences of price action that repeat themselves because human psychology-fear, greed, and hesitation-remains constant even when the assets change.
You do not need a degree in mathematics to spot them, but you do need to understand the logic behind the lines. These patterns tell us whether the current trend is likely to continue or if a reversal is brewing. By recognizing these recurring shapes, you can anticipate breakouts and reversals before they happen, giving you a strategic edge in timing your entries and exits.
Understanding the Two Main Types of Patterns
Before diving into specific shapes, it is crucial to categorize what you are looking at. All crypto chart patterns fall into two primary buckets based on their implication for the trend. Getting this wrong can lead to trading against the momentum, so pay close attention to the context.
- Continuation Patterns: These form during a pause or consolidation phase within an existing trend. Think of them as a deep breath before a sprint. The market is taking a break, digesting recent gains or losses, but the underlying direction remains unchanged. When the pattern resolves, the original trend usually resumes with renewed energy.
- Reversal Patterns: These signal a complete change in direction. They appear at the end of a trend, indicating that the previous momentum has exhausted itself. Bulls and bears exchange control here, marking potential tops or bottoms in the market cycle.
The key distinction lies in the preceding trend. If Bitcoin has been rallying for weeks and then forms a tight shape, it is likely a continuation pattern. If it has rallied for months and suddenly starts forming a complex top structure, watch out for a reversal.
Triangle Patterns: Compression Before the Explosion
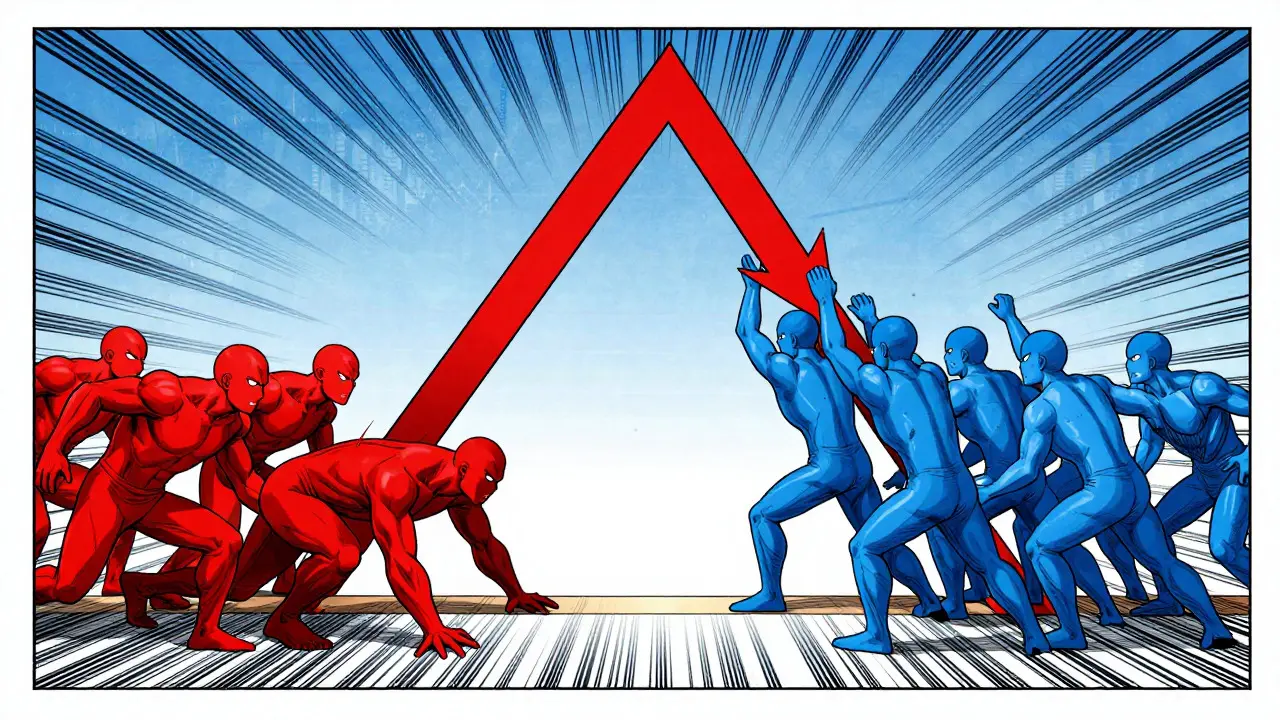
Triangles are among the most common and significant formations you will encounter. They represent market compression, where price action tightens between two converging trendlines. Imagine a spring being coiled tighter and tighter; eventually, it must release. This release is the breakout.
For a triangle to be valid, the price must touch each trendline more than twice. You need at least two lower highs and two higher lows to confirm the formation. There are three main variations, each telling a different story about buyer and seller aggression.
| Pattern Type | Structure | Market Psychology | Typical Outcome |
|---|---|---|---|
| Ascending Triangle | Flat resistance, rising support | Buyers are becoming aggressive, pushing prices higher on each dip. | Bullish breakout above resistance. |
| Descending Triangle | Flat support, falling resistance | Sellers are gaining control, driving prices lower on each rally. | Bearish breakdown below support. |
| Symmetrical Triangle | Converging highs and lows | Market indecision; neither bulls nor bears have control yet. | Breakout in either direction (follow volume). |
In an ascending triangle, buyers are clearly in charge. They refuse to let the price drop as low as it did previously, creating higher lows. Meanwhile, sellers hold a firm ceiling. Eventually, the buying pressure overwhelms the resistance, leading to an upward breakout. Conversely, a descending triangle shows sellers stepping up. Each time the price tries to rally, it hits a lower high. This indicates weakening demand and often leads to a downward crash once the floor breaks.
The symmetrical triangle is trickier because it shows pure indecision. Both sides are fighting, and the range narrows from left to right like a funnel. Trading volume typically dries up during this phase. The breakout direction is unpredictable until it happens, so traders wait for a decisive move accompanied by a surge in volume before entering.
Flags and Pennants: Short-Term Consolidation
If triangles are about compression, flags and pennants are about rest. These are short-term continuation patterns that appear after a strong, sharp price move known as the "pole." The pole represents the initial impulse, while the flag or pennant is the brief pause before the next leg of the journey.
A Bull Flag is a bearish-looking consolidation channel that forms within a larger bullish trend. It looks like a small rectangle or channel sloping slightly downward. Despite the slight dip, the overall sentiment remains positive. Traders use this time to take profits, but new buyers step in quickly, preventing a deeper correction. When the price breaks above the upper boundary of the flag, the uptrend resumes.
Pennants are similar but feature converging trendlines rather than parallel ones, resembling a small symmetrical triangle. A bullish pennant follows a sharp uptrend and consists of a brief period of sideways movement with narrowing volatility. Like flags, they are short-lived, often resolving within a few days or weeks. The strategy here is simple: measure the height of the pole and project that distance from the breakout point to set your profit target.
One critical detail is volume. During the formation of both flags and pennants, trading volume should decrease. This confirms that selling pressure is drying up. When the breakout occurs, volume must spike significantly to validate the move. Without volume, the breakout might be a "fakeout," trapping early entrants.
The Role of Volume and Confirmation
Seeing a pattern is only half the battle. Many formations fail to resolve as expected, leading to losses if you jump in too early. This is why volume confirmation is non-negotiable. Volume acts as the fuel for price movement. A breakout on low volume is suspect; it suggests a lack of conviction from major players.
Real breakouts occur when trading activity surges, indicating that institutional investors or large retail traders are committing capital to the new direction. Always wait for the candle to close outside the pattern boundary before entering. Premature entries are a common pitfall for beginners who mistake a wick for a breakout.
Additionally, consider the timeframe. Higher timeframe patterns (like daily or weekly charts) carry more weight than those on 15-minute charts. A symmetrical triangle on a daily chart is far more reliable than one on a minute-by-minute view. Use multiple timeframes to align your analysis: identify the major trend on the daily chart, then look for entry signals on the 4-hour or 1-hour charts.

Automated Pattern Recognition in Crypto
Manual analysis requires hours of screen time and a keen eye. Fortunately, technology has democratized access to professional-grade tools. Automated chart pattern recognition engines now scan markets 24/7, identifying dozens of patterns across multiple timeframes instantly. Platforms like AltFINS utilize AI to detect classic formations such as Head and Shoulders, along with advanced harmonic patterns like Butterfly and Gartley setups.
This automation saves traders significant time and reduces emotional bias. Instead of staring at screens hoping to see a pattern, algorithms flag opportunities objectively. However, automation is a tool, not a crystal ball. Even AI-identified patterns require human judgment regarding risk management and broader market context. The best approach combines algorithmic scanning with manual verification of volume and trend alignment.
Risk Management and Strategy Implementation
No pattern guarantees success. Market conditions change, and black swan events can invalidate any technical setup. Therefore, risk management is the cornerstone of profitable trading. Never risk more than 1-2% of your capital on a single trade. Place stop-loss orders strategically: for a breakout above resistance, place your stop below the recent swing low or inside the pattern to protect against fakeouts.
Set realistic profit targets based on the pattern's geometry. For triangles, measure the widest part of the formation and project that distance from the breakout point. For flags, use the pole height. Take partial profits at these levels to secure gains, then trail your stop-loss to capture further moves if the trend continues.
Finally, combine chart patterns with other indicators. Relative Strength Index (RSI) can show overbought or oversold conditions, while Moving Averages provide dynamic support and resistance. Using patterns in isolation is risky; using them as part of a comprehensive technical analysis framework increases your probability of success.
What is the most reliable chart pattern in cryptocurrency?
While no pattern is 100% reliable, ascending triangles and bull flags are often considered highly reliable in trending markets because they indicate strong buying pressure. Their reliability increases when confirmed by high trading volume and aligned with the broader market trend.
How do I distinguish between a flag and a wedge?
A flag features parallel trendlines, forming a rectangular channel, while a wedge has converging trendlines. Flags are strictly continuation patterns, whereas wedges can sometimes signal reversals depending on their orientation and position relative to the trend.
Why does volume matter in chart pattern trading?
Volume confirms the strength of a move. Low volume during consolidation indicates indecision, while a surge in volume during a breakout validates the new direction. Breakouts without volume spikes are prone to failure and are often referred to as "fakeouts.">
Can AI replace manual chart analysis?
AI can enhance efficiency by scanning markets continuously and identifying patterns humans might miss. However, it cannot fully replace human judgment regarding market context, news events, and risk management decisions. The best results come from combining AI tools with manual oversight.
What is the difference between a continuation and a reversal pattern?
Continuation patterns, like flags and triangles, suggest the existing trend will resume after a pause. Reversal patterns, such as Head and Shoulders, indicate that the current trend is ending and a new trend in the opposite direction is beginning.